
 Blog RSS
Tuesday
Feb162010
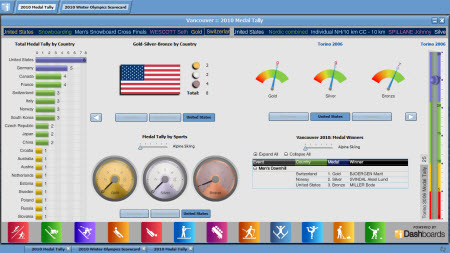
Interactive Olympic Dashboard - very cool
iDashboards is tracking the Vancouver Olympics with its interactive dashboard software. Its updated daily with the days results and the ability to click into details ranging from country medal counts to comparative information from the Torino games in 2006. The dashboard highlights information using speedometers, gauges, interactive country flags, world map overlays, bar charts etc. It free so check it out if your looking to add more details to your Olympic experience.
tagged  Dashboard, Olympics, Vancouver, iDashboards in Analytics, Business Intelligence, SaaS
Analytics, Business Intelligence, SaaS 
